
Left Heart Failure: Understanding the hemodynamics Part 1b: Measuring Preload
- Michael Ritchie
- Oct 31, 2021
- 7 min read
Just to recap, preload is the stretch of the cardiomyocytes at the end of diastole. But when referring to hemodynamics people often equate preload with hypervolemia or increased measured filling pressures, but this is not always the case. Therefore, patients may end up getting the wrong treatment. Let’s take a closer look at why this creates problems (Table 1).
Table 1: Systolic vs. Diastolic Heart Failure

If heart failure is lumped together, providers start to treat patients as one disease type. If we focus on the filling pressures and cardiac output of the left heart, it is easy to fall into the trap that systolic and diastolic heart failure should be treated the same. It is only when you look at the LV volume, contractility, and preload that you see they are very different disease processes. In fact, hemodynamically, diastolic dysfunction probably has more in common with cardiac tamponade than systolic dysfunction.
Table 2: Hemodynamics of Systolic HF, Diastolic HF, and Cardiac Tamponade

So it is very important to understand the different types of decompensated heart failure and how to diagnose them correctly.
Measuring Preload in Decompensated LV Dysfunction:
Step 1: Are they decompensated?
Diagnosing someone with decompensated heart failure is typically done clinically, with symptoms of heart failure that are not limited to dyspnea, fatigue, and weight gain. There are more objective measurements when deciding whether patients are in cardiogenic shock, like lactic acid or measuring markers with a pulmonary artery catheter (PAC).
Step 2: Is there a preload problem
When evaluating these patients for treatment choices, one question is whether or not they have a preload problem.
Figure 1: Starling Curve of Diastolic and Systolic Heart Failure

In Figure 1, if both patients presented with decompensated heart failure, they both have a decreased stroke volume and therefore a decreased cardiac output causing them to be in failure. If a pulmonary artery catheter was placed, they would both show an elevated pulmonary artery occlusion pressure (PAOP), or wedge pressure, and a decreased cardiac output. But, it is easy to see that they have a decreased stroke volume for very different reasons.
Disease Physiology:
Increased Preload:
When there is too much preload, it overstretches the cardiomyocytes and will move the patient to the descending limb of the Starling Curve (Figure 1). This causes a decrease in stroke volume and a decrease in cardiac output. The decrease in forward flow leads to a backup of blood into the left atrium and pulmonary veins. This backup of blood increases hydrostatic pressure and causes pulmonary edema. The backup also causes increased volume in the venous system which leads to hepatic and renal congestion, jugular venous distention, and lower extremity edema.
I have heard arguments that a normal LV does not have a descending limb on the Starling Curve. While I would agree that a functioning LV can compensate significantly longer than a dysfunctional LV, the LV does have a descending limb and should not be given more preload than necessary.
Decreased Preload
If we look at preload as the stretch on the cardiomyocytes, then diastolic dysfunction is due to decreased preload. Diastolic dysfunction is due to one of two mechanisms; 1. Hypertrophy or 2. Decreased lusitropy. Think about the springs being replaced with much stiffer springs so it is much more difficult to stretch them to the needed length.
1. LV Hypertrophy (LVH): This is usually due to long-standing hypertension where the heart continues to pump against high pressure, and this requires more work and the muscle hypertrophies to compensate. When LVH is seen on echo, there is some degree of diastolic dysfunction.
2. Decreased Lusitropy: Lusitropy is discussed in a previous post, but it is the active relaxation of the heart during diastole. Since it requires ATP, ischemia or supply/demand mismatches cause the heart to not relax which decreases filling/stretch and decreases preload.
Volume vs Pressure Problem:
Systolic dysfunction can have decreased lusitropy and ventricular stiffness as well and the lines can blur, but the end result for both is increased pressure in the LV which is what causes the pulmonary edema and venous congestion that is synonymous with decompensated heart failure.
Since systolic dysfunction has decreased contractility and the blood volume stays in the LV which increases the pressure in the LV and increases the pressure in the left atria.
Since diastolic dysfunction cannot relax and has higher pressures for the same volumes and therefore high pressures in the left atrium, but it is not a volume problem in the LV, it is a pressure problem.
Figure 2: Pressure-Volume Loop of the Left Ventricle

The area inside the loops is the stroke volume. Both systolic and diastolic dysfunction have decreased stroke volume, diastolic dysfunction is shifting up making it smaller and systolic is shifted right making it smaller.
Measuring Preload:
The most important part of identifying a preload problem in the LV is being able to figure out if it is a volume problem or a pressure problem. You can know the patient has a preload problem, but if you cannot identify what type of preload problem it will not make a difference.
Unfortunately, most methods of looking at preload in the LV use pressure, which does not narrow it down. Often the assumption is the patient has increased preload and hypervolemia. Using pressure does simplify being able to identify LV dysfunction in general, but I do feel like it causes a reduced understanding of the physiology and therefore providers will often recommend the wrong treatment.
Measuring Elevated Proximal Pressure:
Directly Measured:
1. Left Ventricular End Diastolic Pressure (LVEDP):
This can be directly measured, but it is invasive and typically only done during catheterizations.
Normal LVEDP: 8-12mmHg
2. Left Ventricular End Diastolic Volume (LVEDV)
This is directly measured using echo. This is usually done with Simpson’s biplane method and will give a measurement of the volume in the LV in diastole. It is unreliable since the compliance of the ventricle is unknown and it is hard to determine if the increased volume actually leads to overstretching. It can be helpful to use LVEDV index to normalize it to body surface area (LVEDVI).
Normal LVEDV (LVEDVI): 75 – 150 mL (40-75 mL/m2)
Indirectly Measured:
1. Pulmonary Artery Occlusion Pressure (PAOP) or Pulmonary Capillary Wedge Pressure (PCWP)
This is probably the most common way of measuring the filling pressures on the left side of the heart. This is done with a pulmonary artery catheter (PAC), or Swan-Ganz Catheter. Many places do not regularly wedge and use the pulmonary artery diastolic pressure as a surrogate if it is known to correlate.
PAOP can be used as a surrogate to measure LVEDP. It has never been shown to be reliable in determining volume status in a patient. This is the same as using CVP to look at the right ventricle. Looking at the pressure will help identify people at risk for pulmonary edema, but is invasive. Let us explore how PCWP could represent preload.
PCWP is a surrogate for
↓
LAP, which is a surrogate for
↓
LVEDP, which is a surrogate for
↓
LVEDV
The end answer is that we are trying to make pressure represent volume. In order for a pressure to represent a volume, there would have to be a linear relationship (Figure 3).
Figure 3: Incorrect assumption for pressure and volume

This is not an accurate representation of the pressure versus volume relationship. The actual relationship can be seen on the pressure-volume loop in Figure 2. The bottom of the loop is the pressure change with adding volume during diastole with the end-diastolic volume in the bottom right (Figure 2). Just like CVP, the end result is that PCWP or LAP is unreliable on a physiological level. It may be helpful in trends. If the patient’s PCWP was 25mmHg and now it is 15mmHg, that probably means a decrease in volume or improved cardiac relaxation.
Normal PAOP (PCWP): 8-12 mmHg
2. Estimating LAP using Echo:
This is relatively easy to do if you have some comfort with point of care echo. There are many podcasts and blogs that describe the diagnosis of diastolic dysfunction with echo and it needs its' own blog post to go into full depth.
Mitral Valve Velocities and Tissue Doppler:
In the apical 4 view, all 4 chambers are visualized from the apex. Pulse Wave Doppler is used to look at the velocity of the blood flow through the mitral valve into the LV. It will also look at the velocity of the tissue of the mitral annulus, or base of the mitral valve. These measurements are used to help diagnose diastolic dysfunction.
The measurement of the velocity of the initial blood flow through the mitral valve is represented with E. The initial velocity of the mitral annulus is represented with e’. The LAP can be estimated by dividing E by e’ where normal is 8-15 and >15 is consistent with elevated filling pressures and correlates with PAOP >12mmHg.
LAP = E/e’
Normal est E/e': 8-15 mmHg
Here are some links:
https://123sonography.com/blog/diastolic-function-simple-echo-approach https://www.cardioserv.net/identify-diastolic-dysfunction/
Pulmonary valve regurgitation gradient
Additionally, you can estimate LAP by echo using the pulmonic valve regurgitation gradient plus right atrial pressure, but is more difficult to obtain and is explained in the Blanco et al. (5)
Other methods previously discussed in the RV Series
GEDV:
The global end-diastolic volume measures the volume in all 4 chambers. This can be calculated using the transpulmonary thermodilution catheter. This is also divided by BSA for a global end-diastolic index (GEDI). This requires a transpulmonary catheter system involving a femoral arterial line and upper body central venous catheter that is specialized.
Figure 4 Transpulmonary thermodilution catheter

Stroke volume variation:
This is used to evaluate for fluid responsiveness during resuscitation. But if there is no responsiveness you may be able to say the patient is euvolemic or hypervolemic. This is evaluated using an arterial line +/- Vigileo-FloTrac which directly gives a percentage of SVV where a change >13% implies fluid responsiveness (Figure 5).
Figure 5: Stroke volume variation

https://slidetodoc.com/advance-in-hemodynamic-monitoring-by-dr-h-p/
Figure 6: FloTrac Stroke Volume Variation
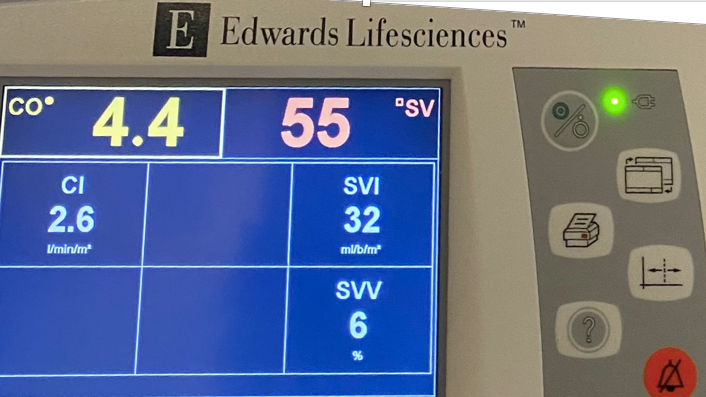
Photo by Anne Caulder
Summary:
Preload problems can cause both systolic and diastolic heart failure exacerbation. It is important to evaluate whether the elevated proximal pressure is due to too little or too much preload.
I will always look at the bedside echo and get an idea of what the LV function is when I have a patient with elevated filling pressures. There are patients where they have a poor EF but still mainly just have a pressure problem and not as much of a volume problem. When I have a PAC in place, I like to look at both the CVP and PAOP. While the absolute number can be misleading, looking at the two numbers at the same time can be helpful. If the PAOP is elevated and the CVP is normal it is most likely an LV pressure problem and not a volume issue. The focus should be on lusitropy. If the CVP is elevated and PAOP is normal, then there is most likely an RV issue with either decreased contractility or increased preload. If both are elevated, there is probably a volume problem, and the patient can be diuresed.
Table 3: Using Filling Pressures to Guide Treatment

Figure 7: Evaluating LV Preload

Table 4: Preload Assessment

References:
1. Rigolli, Marzia & Whalley, Gillian. (2013). Heart failure with preserved ejection fraction. Journal of geriatric cardiology : JGC. 10. 369-376. 10.3969/j.issn.1671-5411.2013.04.011.
2. Sumeet S. Mitter, Sanjiv J. Shah, James D. Thomas, A Test in Context: E/A and E/e′ to Assess Diastolic Dysfunction and LV Filling Pressure, Jour Amer Col of Card, 2017; 69(11):1451-1464
3. Anethesia Key. https://aneskey.com/9-3/. Accessed on 10/23/21
4. THE AMERICAN SOCIETY OF ECHOCARDIOGRAPHY RECOMMENDATIONS FOR CARDIAC CHAMBER QUANTIFICATION IN ADULTS: A QUICK REFERENCE GUIDE FROM THE ASE WORKFLOW AND LAB MANAGEMENT TASK FORCE. https://asecho.org/wp-content/uploads/2018/08/WFTF-Chamber-Quantification-Summary-Doc-Final-July-18.pdf. Accessed on 10/23/21


Comments